2nd Quarter 2025: Earnings Over Headlines
Markets recovered in V-shaped fashion in the second quarter of 2025, completely erasing their tariff-driven decline to make new all time-highs. Investors looked past geopolitical issues, and fears of a new inflation spike have not yet materialized. While news headlines have certainly been chaotic, stock market and economic fundamentals have been largely unaffected, at least thus far.
We see several notable catalysts with the potential to drive markets higher in the back half of the year. While consumer sentiment surveys (“soft data”) have been weak, spending and employment data (“hard” data) has been resilient. While unemployment, tariff, and geopolitical uncertainty remain, there are few indications of imminent recession. The passing of the U.S. budget bill should be supportive for consumers and businesses as it maintains the elevated level of government fiscal stimulus, while upcoming bank deregulation should ease access to capital and boost lending across the economy.
Profits Remain Supportive
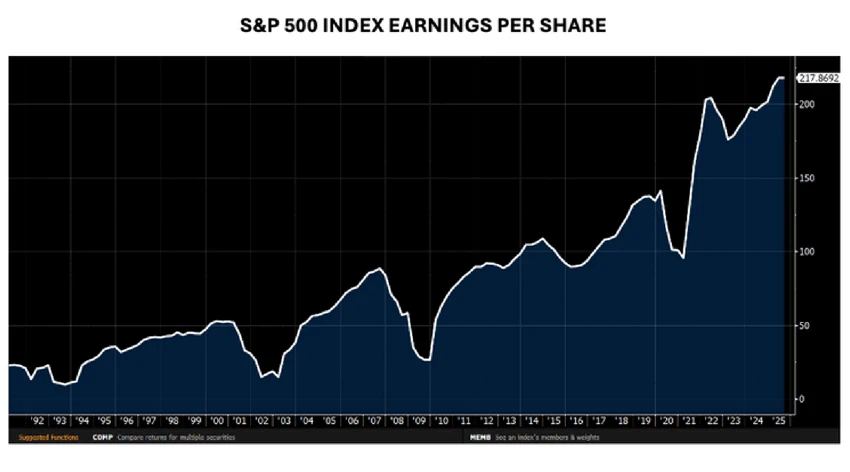
Buoyed by hundreds of billions of dollars of Artificial Intelligence-related investments, S&P 500 earnings have been extraordinarily strong. The A.I. spend is set to continue, and the four primary Hyperscalers (Alphabet, Amazon, Meta, and Microsoft) plan to invest more than $1 trillion over the next four years. Earnings for the S&P 500 are expected to grow 11% for the full year 2025 and then another 12% in 2026.
Active Management
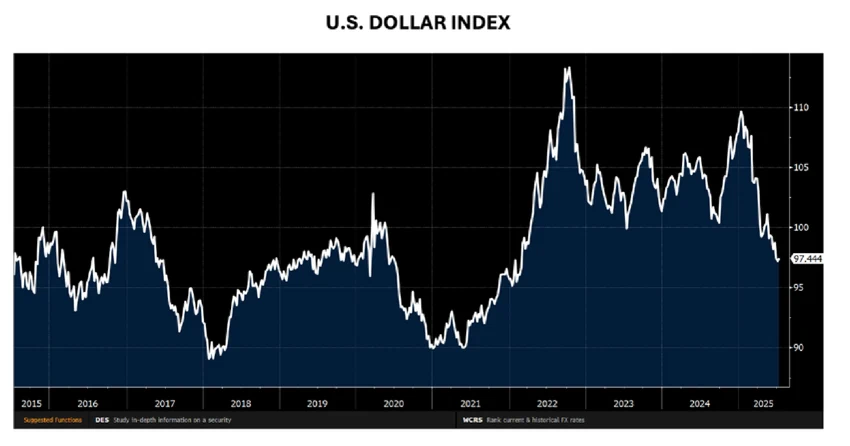
The U.S. dollar declined against other major currencies, resulting in the outperformance of international stock markets. This dollar decline was driven in large part by European investors repatriating capital. However, with approximately 50% of S&P 500 earnings coming from abroad, a weaker dollar is likely to boost earnings for American large caps.
Interest Rates and Policy
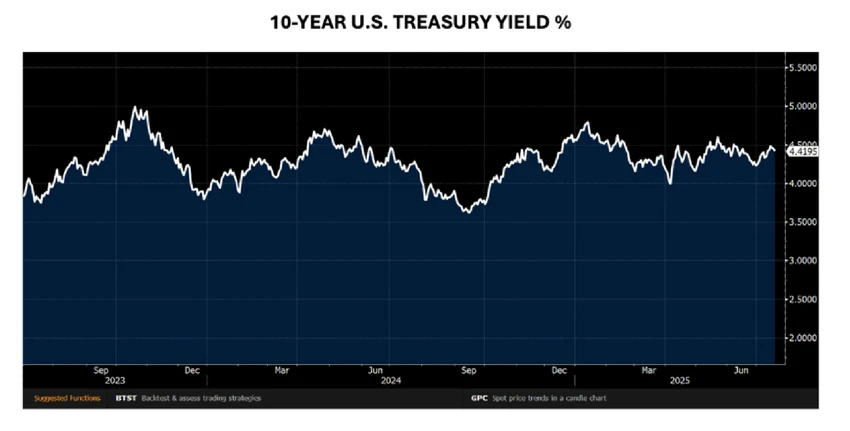
Interest rates overall have been fairly rangebound since mid-2023. The market currently expects 0.50% of Fed rate cuts in the back half of the year, but this will be highly dependent on how inflation develops.
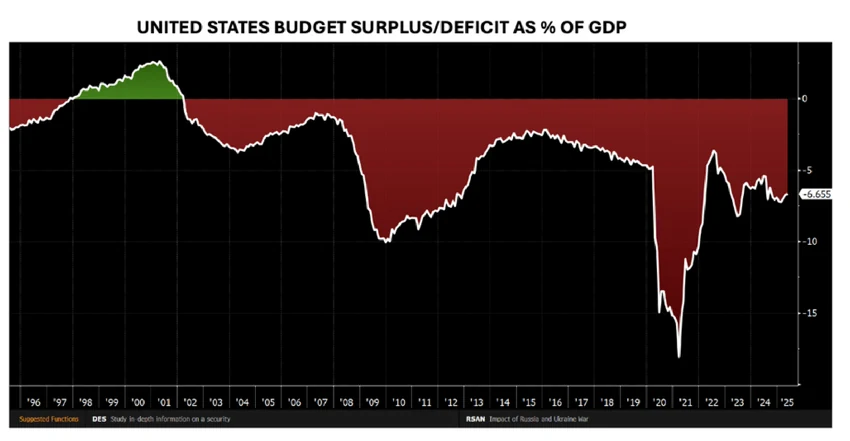
The passing of the budget bill has cemented America’s unprecedented pro-cyclical budget deficit going forward. While in the short-term the massive government stimulus should be beneficial for corporate earnings, long term inflationary risks have risen significantly, especially as Federal Reserve independence has begun to erode. We can expect bank deregulation to become a priority in the second half of the year.
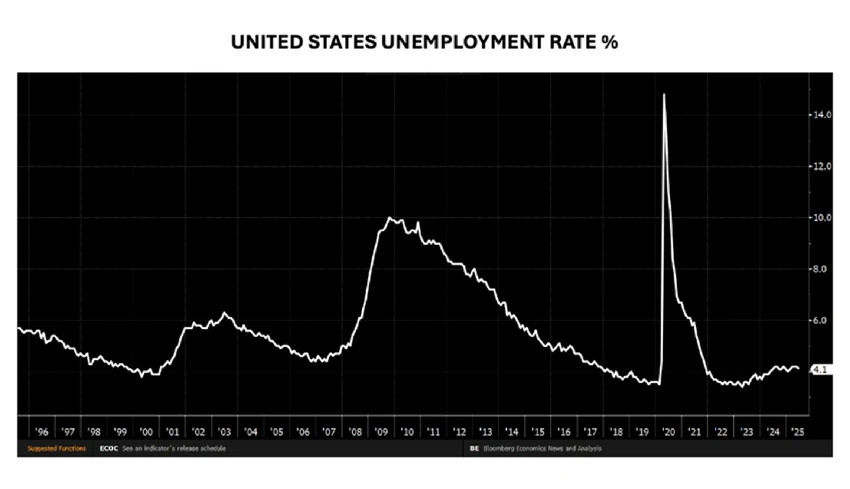
While hiring has undoubtedly slowed, the U.S. unemployment rate has stabilized at low levels. We are, however, closely watching the development of the labor market as A.I. implementation progresses. Layoffs have recently spiked dramatically within the technology sector, with Microsoft specifically laying off approximately 4% of its entire workforce.
We understand that layoffs associated with new technology are causing a great deal of anxiety. However, past revolutionary technological advancements have created jobs rather than destroyed them. While there will be friction in the short-term, we expect A.I. to drive productivity gains, increase societal wealth, and empower American workers rather than replace them.
While the stock market has rallied impressively off the April lows, this is not an easy investing environment. Valuations are high and earnings guidance is optimistic, leaving room for companies to disappoint. Forecasting is difficult as the range of outcomes for inflation, growth, and government policy is wide. With so much good news priced into markets already, further upside could be harder to come by. In the short term, we do expect to see a bit of consolidation as markets digest recent gains.
Second Half Risks
We remain focused on the primary fundamental factors that drove markets to record highs. We see significant upside in nuclear energy, energy infrastructure, and defense, and these industries should prove less vulnerable in the event of a negative geopolitical surprise. Thanks to technological advancements and improved policy, we see a long-term trend towards a healthier America and are positioning the portfolios to benefit from this transformation.
Headlines Change, Fundamentals Endure
We remain focused on the primary fundamental factors that drove markets to record highs. We see significant upside in nuclear energy, energy infrastructure, and defense, and these industries should prove less vulnerable in the event of a negative geopolitical surprise. Thanks to technological advancements and improved policy, we see a long-term trend towards a healthier America and are positioning the portfolios to benefit from this transformation.