Worlwide Dividend PlusStrategy Overview
Portfolio Strategy
Portfolio Details
Top Ten Holdings
MV 47%
Broadcom Inc
Gallagher Arthur J & Co
Waste Management Inc
ABB Ltd ADR
Microsoft Corp
JP Morgan Chase & Co.
Eaton Corp PLC
Chevron Corp
Altria Group Inc
Duke Energy Corp
Portfolio Snapshot
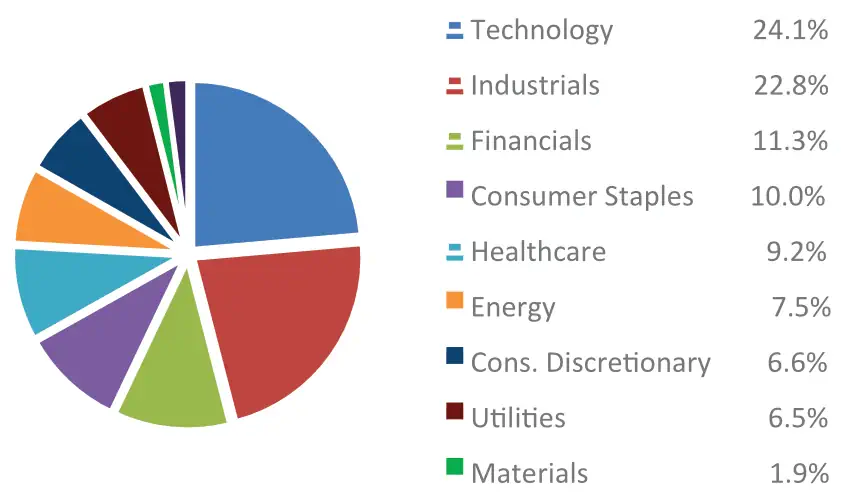
Sector Percentages as of 3/31/2025
Annualized Performance Percentages
Period Ending 3/31/2025
| QTD | 2025 | 3 Year | 5 Year | 10 Year | |
|---|---|---|---|---|---|
| Worldwide Dividend+ Gross | (1.0%) | (1.0%) | 6.6% | 13.6% | 9.1% |
| Worldwide Dividend+ Net | (1.2%) | (1.2%) | 5.7% | 12.7% | 8.3% |
| Global Dividend Index | 4.1% | 4.1% | 5.8% | 16.2% | 8.7% |
Portfolio Management Team


Want more detailed information about this portfolio?
Reach out and one of us will get back to you soon.
Certain Disclosures for SAM’s Strategies & Representative Account Performance Strategy Asset Managers, LLC (founded in 2001) is an independent registered investment adviser, which is 100% owned by Hulick Capital Management, LLC. Strategy Asset Managers, LLC claims compliance with the Global Investment Performance Standards (GIPS®). Strategy Asset Managers, LLC has been independently verified for the period ending December 31, 2021, and all other performance is preliminary. Investing involves risk and possible loss of principal capital. No advice may be rendered by Strategy Asset Managers, LLC unless a client service agreement is in place. Investing involves risk and possible loss of principal capital. No advice may be rendered by Strategy Asset Managers, LLC unless a client service agreement is in place. The Worldwide Dividend Plus strategy performance reflects the results of composite members that are discretionary accounts that seek to outperform our custom “Global Dividend Index”. The strategy utilizes a bottom-up, fundamental analysis “relative value” approach to selecting common stocks. The objective is to buy “high quality” large capitalization companies (both domestically and internationally via ADRs) at a discount to their fair market value. The strategy emphasizes companies with above market dividend yields, consistent payment of dividends and/or the prospect of increasing dividends. Benchmark: Global Dividend Index, which consists of 80% iShares Select Dividend ETF and 20% iShares MSCI EAFE ETF. The US dollar is the currency used to express performance. The iShares Select Dividend ETF seeks to track the investment results of an index composed of relatively high dividend paying U.S. equities. The ETF returns reflect the deduction of all expenses and transaction costs incurred by the iShares Select Dividend ETF. As of December 31, 2023, the expense ratio was 0.38%. The iShares Select Dividend ETF returns reflect the closing prices, which are determined by the last traded price of the ETF. The iShares MSCI EAFE ETF seeks to track the investment results of an index composed of large- and mid-capitalization developed market equities, excluding the U.S. and Canada. The ETF returns reflect the deduction of all expenses and transaction costs incurred by the iShares MSCI EAFE ETF. As of December 31, 2023, the expense ratio was 0.33%. The iShares MSCI EAFE ETF returns reflect the closing prices, which are determined by the last traded price of the ETF. Portfolio characteristics, sectors weightings and holdings are subject to change, and provided for informational purposes only. A complete list of holdings for the past year is available upon request. Holdings are not security recommendations. The net investment performance reflects the deduction of advisory fees, custodial expenses, commissions and any other expenses incurred in the management of the account. Index returns have been taken from public sources, which are believed to be reliable and accurate; however, the accuracy of such information cannot be guaranteed. Strategy Asset Managers’ maximum annual advisory fee is 2.00%. Investment advisory fees for all of the SAM strategies are fully disclosed in Form ADV Part 2A. GIPS® is a registered trademark of CFA Institute. CFA Institute does not endorse or promote this organization, nor does it warrant the accuracy or quality of the content contained herein. To receive a GIPS report, please contact info@strategyasset.com