
January Monthly Recap
After a strong performance in 2019, the U.S. and broader equity markets posted strong returns until volatility picked up towards the end of the month. Concerns over the coronavirus outbreak tempered enthusiasm that followed the signing of the phase one trade deal between the U.S. and China. We also saw some easing in Middle East tensions, an accommodation on the NAFTA, Japan and European trade fronts, and relatively stable economic metrics, but the unfolding earnings reporting season has thus far been decent, with selective strength among the banking group. In all, the U.S. economic fundamentals continue to lead by example and global economic conditions are improving to support the U.S. and global equity markets.
During the month, long-term interest rates went down, forward twelve-month EPS estimates went up, and the Federal Reserve hinted it is unlikely to raise the target range for the fed funds rate anytime soon. We saw some familiar themes play out in January – Growth outperformed Value, Large Caps outperformed Small Caps, Technology was among the leading sectors and Energy was among the laggards. With the turn in sentiment, risk averse assets outperformed. The U.S. equity markets continued its leadership and outperformed foreign markets.
Coronavirus Outbreak Continues to Distress Markets
The Wuhan coronavirus has exacerbated worries about the potential impact, as well as the understanding that cases have been identified in other countries such as the U.S., Canada, France, South Korea, and Japan. However, in slowing the spread, the world has also slowed the global economy for the quarter. Especially hard hit will be China who seems to be preparing for a quarter of their GDP to be lost in the near term. And because they are the largest consumer and buyer of global commodities, all prices have been hit hard. China’s stock, currency and bond markets have all been closed due to the outbreak of a new coronavirus since Jan. 23 and were reopened on February 2. According to Reuters, China’s central bank said it will inject 1.2 trillion yuan ($174 billion) worth of liquidity into the markets via reverse repo operations. This will have many pluses and minuses all around the world as the shut down and recovery ripples through. (Data Source: FactSet)
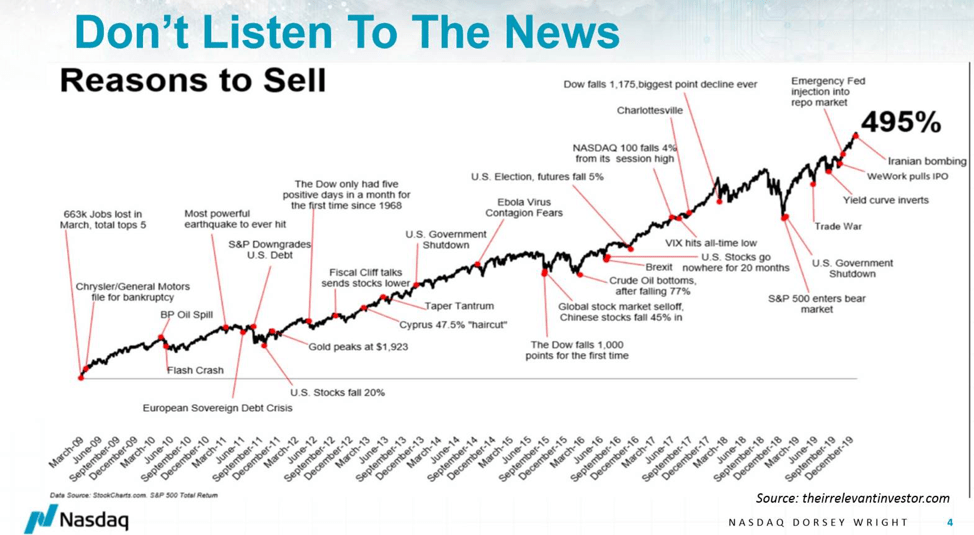
We don’t know what is going to happen with the coronavirus. It stands to reason that it will get worse before it gets better. Market history, meanwhile, has its share of medically induced selloffs, each of which has eventually been answered with a full recovery. Historically, if we look at price performance, U.S. equity returns were higher one, two, and three months after the first recorded U.S. incidents of SARS, MERS, Ebola, and Zika (Source: CFRA). The key is whether the escalation of cases feeds a broad retrenchment in consumer spending. We are mindful that this is a small sample size and each situation is different, so we continue to monitor the virus closely. For now, however, the impact of the virus is far more psychological than fundamental for the companies and markets that we are invested in. As such, our fundamental Market Outlook has not been significantly altered.
Interest Yields Lower
The Federal Reserve’s Open Market Committee (FOMC) met on January 29 and voted unanimously to keep its policy rate steady in the 1.50% – 1.75% range. This was the second consecutive meeting at which the Fed declined to reduce interest rates after three successive cuts between July and October of last year. Fed Chair Jerome Powell mentioned the China coronavirus as a new source of economic uncertainty. However, Powell reiterated his stance from the last meeting that he expects the current policy stance to remain appropriate for the foreseeable future.
Following the announcement, the markets are now pricing in two Fed rate cuts this year. Look at last year, the Fed lowered rates 3x and added massive liquidity which kept the markets moving higher. Expect the same this year; Fed Futures now seeing Sept rate cut probability & Dec cut 75%. Historically, the markets perform well for 12 months after 3rd cut, however, 2021 outlook is not so certain. We also wanted to provide a little historical perspective; in 2000 U.S. Treasuries would have yielded about 6.5%. Today rates are sub 2% and the U.S. is one of the highest government yields in the world.
Earnings
The importance of earnings releases has taken a backseat due the Coronavirus. 2020 EPS growth estimates are at risk right now. The market, however, senses some vulnerability in those estimates since analysts really don’t have a good sense yet of the impact the coronavirus will ultimately have on global economic activity. For those companies with high sales to China or a dependency on a global commodity, near-term forward revisions may be lowered. According to CFRA Research, S&P Capital IQ consensus estimates now point to a 3% gain in S&P 500 profits in Q4 versus the initial forecast for a 2.1% decline. Also, two-thirds of the 125 subindustries in the S&P 500 have seen upward revisions to their Q4 estimates. Currently, the S&P 500 trades at 18.6x forward twelve-month earnings. That’s high relative to the 10-year historical average of 14.9x, FactSet but the discount rate is lower.
What is on our Radar for 2020?
In 2020, the markets deal with rising late-cycle conditions, election year uncertainty and slowing external growth. We think inflation and fears of higher interest rates will again be the focus, and central banks have little ammunition to confront an unexpected slowdown. Job growth was a pillar of strength in 2019 and a slowdown could derail the economy. The ongoing trade war and negative credit surprises could damage confidence causing businesses and consumers to retrench. Watch the price of oil as any super spike could dent consumer spending. When we look at the economy, we think it is slowing but growing, job growth is strong, and the U.S. consumer continues to spend. Globally, we continue to see signs of improvement and, with major central banks set to remain accommodative in the coming year, near-term recession fears appear to be subsiding.
Market performance is always driven by fundamentals like corporate earnings, interest rates and the state of the economy. Now we are at the beginning of the coronavirus outbreak. Whether it can change the current fundamentals remains to be seen. Despite all of the negative headlines, the stock market continues to power higher. As of year-end, the current expansion which began in June 2009, is now the longest in history at 126 months. This is also the first decade without a recession. (Source Dorsey)
Liquidity Trumps Uncertainty
Political uncertainty itself is unlikely to disrupt financial markets unless there is some evidence that it is impacting the behavior of companies and consumers. If it were to rise to the point where it did so, that would be a game changer. That said, for now, hiring remains robust and consumers continue to spend. In this regime greater liquidity should prove an effective balm for the occasional case of geopolitical jitters. A concern that Jefferies Research reported is that complacency over an inevitable US slowdown will lead to an unwinding of the bullish positioning in fixed income. So, we will watch if rates move to fast like they did in February and October of last year.
Gold in Today’s Uncertain Market Environment
Gold prices are surging to their highest levels in more than six years, building upon the breakout that began back in June 2019. As geopolitical turmoil escalates, it isn’t much of a surprise to see this “safe-haven” investment vehicle attract bids. According to the World Gold Council’s Gold Demand Trends Q3’2019, a total of fourteen central banks have reported adding to their gold reserves by one metric ton (t) or more for a total of 547.5t through the first three quarters. But, gold demand was not limited to central banks. Global investors bought 400t of gold through physically backed ETFs in 2019, bringing their collective holdings to a record high of 2,881t3 surpassing the previous peak set in 2012 when the price of gold was almost $200/oz higher than recent levels. In a low or negative rate environment the opportunity costs associated with gold potentially diminish along with the significance of it lacking a dividend.
2020 Expectations
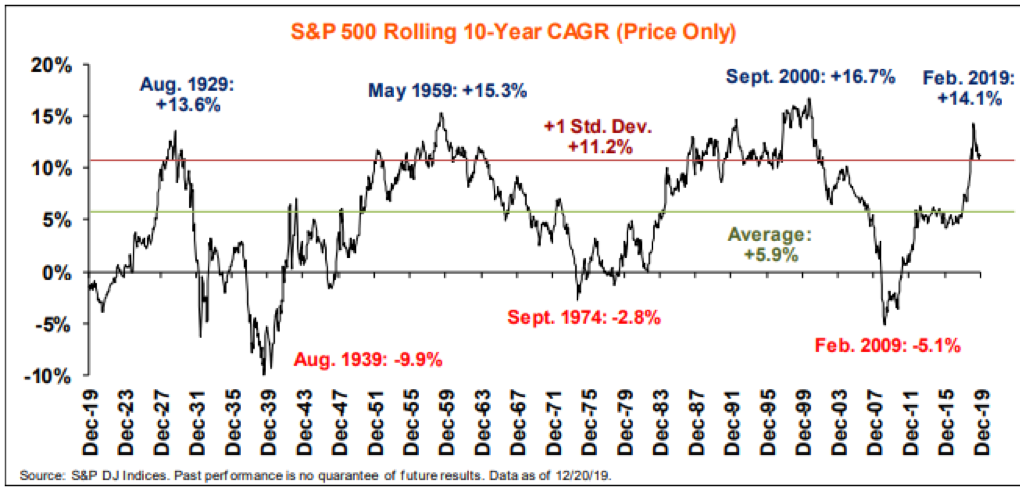
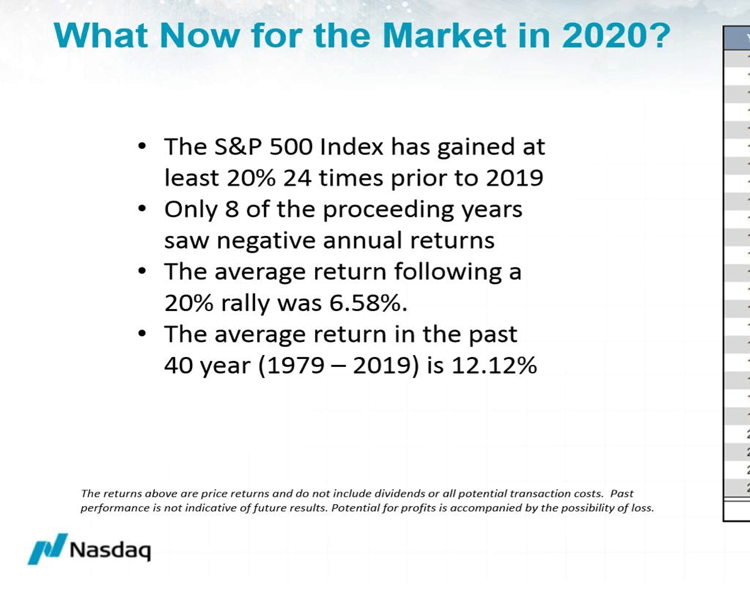
Historically, years with strong annual gains are typically positive the next year. After an annual gain of 20% or more, the following year is up 8% on average and is positive two-thirds of the time (Data Source: SunTrust IAG, FactSet). Also, the U.S. presidential cycle heavily favors third years (2019), with fourth years still being positive, but more moderately so. We should expect the forward returns will not be as rewarding as the last 10-year period.
During all years since WWII, the S&P 500 recorded an average 10-year price gain of 7.2%. However, the average 10-year return following the top 20 slipped to 6.0%. What’s more, from a shorter-term perspective, in the calendar year after the top 20 strongest 10-year returns, the S&P 500 rose an average of only 5.6% and gained in price just 55% of the time, as compared with the average increase of 7.9% and 71% frequency of advance for all years since 1945. As a result, history reminds us that returns will still likely be positive, just less so.
Technically
Uncertainty returned to broader equity markets amid growing concerns surrounding the effects of the recent coronavirus outbreak in China and what it may have on the global economy. We are starting to see some distribution for the first time since the October lows. Complacency has been high along with the market making new highs. It appears traders were riding the trend up into earnings season and then react and take profits if necessary. However, the bigger picture trend remains up. The shorter-term/minor trends, which are more susceptible to the day-to-day “noise” and opinions, is currently under pressure. While each of the major domestic equity indexes saw recent declines, intermediate and long-term indicators for the space remain positive.
What it All Means
After a great year for the markets, are base case scenario is for a good year in 2020. Economic weakness continues from the rise in protectionism and broad trade policy uncertainty keeps the Fed accommodative. The trade situation has improved, the Fed is more accommodative, equity inflows improved, technicals are strong and debt levels are being serviced, but going higher. We also see the de-escalation of the U.S.-China trade dispute, which removes uncertainty and is positive for U.S. companies purchasing overseas goods. This is a good sign and needs to continue.
Recently our Chairman of the Board, Carl W. Hulick had lunch with Bill Hurt, a legendary figure in the investment community and was Carl’s mentor and teacher, 60 years ago, at Dean Witter. Mr. Hurt retired last summer after fifty years at the Capital Group, one of the major investment firms with more than $650Bl of assets under management. Bill’s early teachings remind us that we live in an uncertain, ever changing, and increasingly complex; and our nature is to worry and try to stop change. Yet despite all the angst over the crisis of the moment, a self-interested mankind adapts somehow and has always muddled through. Think 1910, there were plenty of people that had no electricity, no indoor plumbing, to whom horsepower meant horses, had not seen an airplane and could not imagine all the things we take for granted in 2020. Finally, Bill provided his updated way of thinking about the world: it is a “complex, competitive, adaptive-system, self-regulating and transformative.” Their lunch ended agreeing that there will continue to be unimaginable discoveries and innovation to exponentially advance the culture and well-being of all mankind.
Happy new decade it will be exciting.